The MEMS model is actively being developed, with three major versions currently built. MEMS V1 is a simplified model with a single soil layer. MEMS V2 is a one-dimensional, fully integrated agro-ecosystem model. MEMS V3 expands to a two-dimensional framework, simulating the spatial distribution of grazing animals across a landscape. More detailed descriptions are provided below. MEMS model versions are made available upon publication through our Soil Carbon Solution Center at CSU (https://www.soilcarbonsolutionscenter.com/mems).
MEMS V1
The MEMS V1.0 model is a simple one soil layer process-based model that simulates soil carbon formation and decomposition (Figure 1). The model was published in the journal Biogeosciences by Robertson et al. (2019). This version is rewritten in the computer language Java with improved coding structure and input file structure. The computation speed has also been substantially improved.
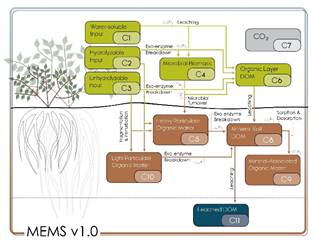
Figure 1. Conceptual model diagram of MEMS v1.0.
MEMS v1.0 was developed from the Microbial Efficiency-Matrix Stabilization framework (Cotrufo et al., 2013), and the two pathway model of soil organic matter (SOM) formation (Cotrufo et al., 2015) and represents the importance of the chemistry and physical nature (soluble versus structural) of organic matter inputs for the efficiency of microbial processing and ultimately the formation of dissolved, particulate and mineral associate organic matter in bulk soil. Building on this framework, MEMS v1.0 is also capable of simulating the concept of carbon (C) saturation.
Nine C pools were defined in this model. Litter pools of MEMS v1.0 are defined as > 2mm particles and comprise of hot-water extractable (C1), acid-soluble (C2) and acid-insoluble (C3) fractions. A microbial pool (C4) and dissolved C pool (C6) are also part of the organic horizon and litter decomposition processes (see LIDEL for more information; Campbell et al., 2016). Soil organic matter (< 2mm particles below ground) comprises a light particulate organic matter pool (light POM, C10) formed from the input through fragmentation and physical transfer of the structural litter residues (C2 and C3), an organic matter pool associated to the coarse heavy soil fraction (C5) formed from both litter fragmentation and microbial residues coating sand-sized particles, a dissolved organic matter pool (DOM, C8) formed from the decomposition of all other pools and receiving DOM from the organic soil layer, and a fine mineral-associated organic matter pool (MAOM, C9), which exchanges C through sorption and desorption with the DOM (C8).
The Java version of the MEMS V1 model is available through our Soil Carbon Solution Center at CSU (https://www.soilcarbonsolutionscenter.com/mems).
MEMS V2
The MEMS V2 model (Zhang et al., 2021) is a process-based ecosystem model simulating soil organic matter (SOM) dynamics representing measurable biophysical SOM fractions (Figure 2). Unlike predecessor models (e.g., CENTURY, DNDC, EPIC, Roth C) that have kinetically-defined SOM pools (not measurable), MEMS, and other next generation models (e.g. COMISSION, CORPSE, MEND, Millennial, MIMICS) are explicitly modeling measurable carbon (C) pools – bringing the SOM modeling paradigm closer to reality. In addition, MEMS models soil organic carbon (SOC) in deep soil layers, making the model suitable for simulating rangeland SOC dynamics, where deep roots are persistent features of the landscape and play a key role on SOM dynamics.
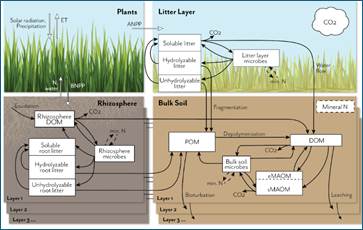
Figure 2. Schematic representation of the MEMS V2 ecosystem model, showing detailed pools and fluxes for the litter and soil components. The full model represents soil organic carbon (SOC) and nitrogen (N) fluxes among atmosphere, plants, and soil in multiple soil layers down to a user-defined depth. Inputs and recycling of N cause feedbacks to net primary productivity (NPP), which is allocated above (ANPP) or below ground (BNPP) and at different depths, depending on vegetation and soil traits. Plant C and N litter inputs (simulated in the plant growth submodel; not shown in detail here) are allocated to three different measurable detritus pools that differ in their solubility and chemical structure. Root exudates contribute to the rhizosphere dissolved organic matter (DOM) pool. These plant input pools lose mass through leaching, microbial catabolism/anabolism, and fragmentation, with different rates depending on the pool C:N chemistry, temperature sensitivity, and mineral N and water demand/availability. Microbial and plant debris contribute to three physically defined and measurable soil organic matter (SOM) pools, according to current understanding (e.g., the dual-pathway model of SOM formation (Cotrufo et al., 2015), in vivo vs. ex vivo microbial processing (Liang et al., 2017), and point of entry (Sokol et al., 2019)): soil DOM, particulate organic matter (POM), and mineral-associated organic matter (MAOM). The MAOM consists of exchangeable and stable component pools (eMAOM and sMAOM, respectively). Microbial pools immobilize and mineralize N, which feeds back to plant production and soil biogeochemical processes. Multiple soil layers are represented by the same belowground model structure, with DOM and mineral N moving through the soil profile and roots contributing fresh inputs at depth.
MEMS V2 simulates plant growth, soil temperature, and soil water movement, and represents SOC and nitrogen (N) fluxes among the atmosphere, plants, and a multi-layered soil structure. The net primary productivity (NPP) is allocated to above- and below-ground biomass production. Below-ground biomass production is further separated among different soil layers, depending on vegetation and soil traits. Plant C and N litter inputs are allocated to three different measurable detritus pools that differ in their solubility and chemical structure. Root exudates contribute to the rhizosphere dissolved organic matter (DOM) pool. These plant input pools lose mass through leaching, microbial catabolism/anabolism, and fragmentation, with rates depending on C:N ratio, temperature sensitivity, mineral N, and water demand/availability. Microbial and plant debris contribute to three physically defined and measurable SOM pools, DOM, particulate organic matter (POM), and mineral-associated organic matter (MAOM). The MAOM consists of exchangeable (eMAOM) and stable (sMAOM) pools. Multiple soil layers are represented by the same belowground model structure, with DOM and mineral N moving through the soil profile and roots contributing fresh inputs at depth.
In MEMS V2, soil temperature and soil water content are calculated for each soil layer. Soil surface temperature is calculated as a function of air temperature, litter biomass, plant biomass, and snow depth. MEMS simulates multi-layer water transport and the advection-dispersion equation for solute transport of DOM, and mineral N. Mineral N can be taken up by plant roots and microbes. The model also calculates potential evapotranspiration (ET), using daily maximum and minimum temperatures.
The plant growth submodule simulates both annual and perennial herbaceous plants based on radiation use efficiency and NPP. Aboveground NPP is allocated to leaves, stems, and seeds, while belowground NPP is distributed among coarse roots, fine roots, and exudates. Partitioning between roots and shoots is based on plant species specific parameters with root depth increasing from plant emergence to maturity and root exudation estimated as a fraction of below ground C allocated. The model can also simulate the impact of fire on aboveground live and dead biomass and surface litter, according to user-defined parameters.
Besides the 2.0 version, MEMS exists also in the 2.14 version (Zhang et al., 2024), parameterized to represent cropping systems, and the 2.34 version (Santos et al., 2024), parametrized to simulate adaptive grazing management.
MEMS V3
The MEMS V3 (Zhang et al., preprint) is our latest version that was designed to simulate various grazing management (Figure 3). Building from V2.34, MEMS V3.0 has a two-dimensional structure that divides the landscape into spatial cells. In each daily time step, the animals are distributed according to the management options. The model can be used to simulate diffetent grazing strategies, including conventional grazing such as continuous grazing and low frequency rotation, as well as regenerative grazing stragegies such multi-paddock grazing. In the model management schedule file, users can specify the stocking density (animal units per hectare), individual grazing period, supplemental feed (if any), and animal type. Each spatial cell in the V3.0 model is a simulation of the one-dimensional MEMS V2.34. We also added a new set of organic pools on the soil surface to represent the manure production from animals. Urine is directly added to the soil as mineral N.
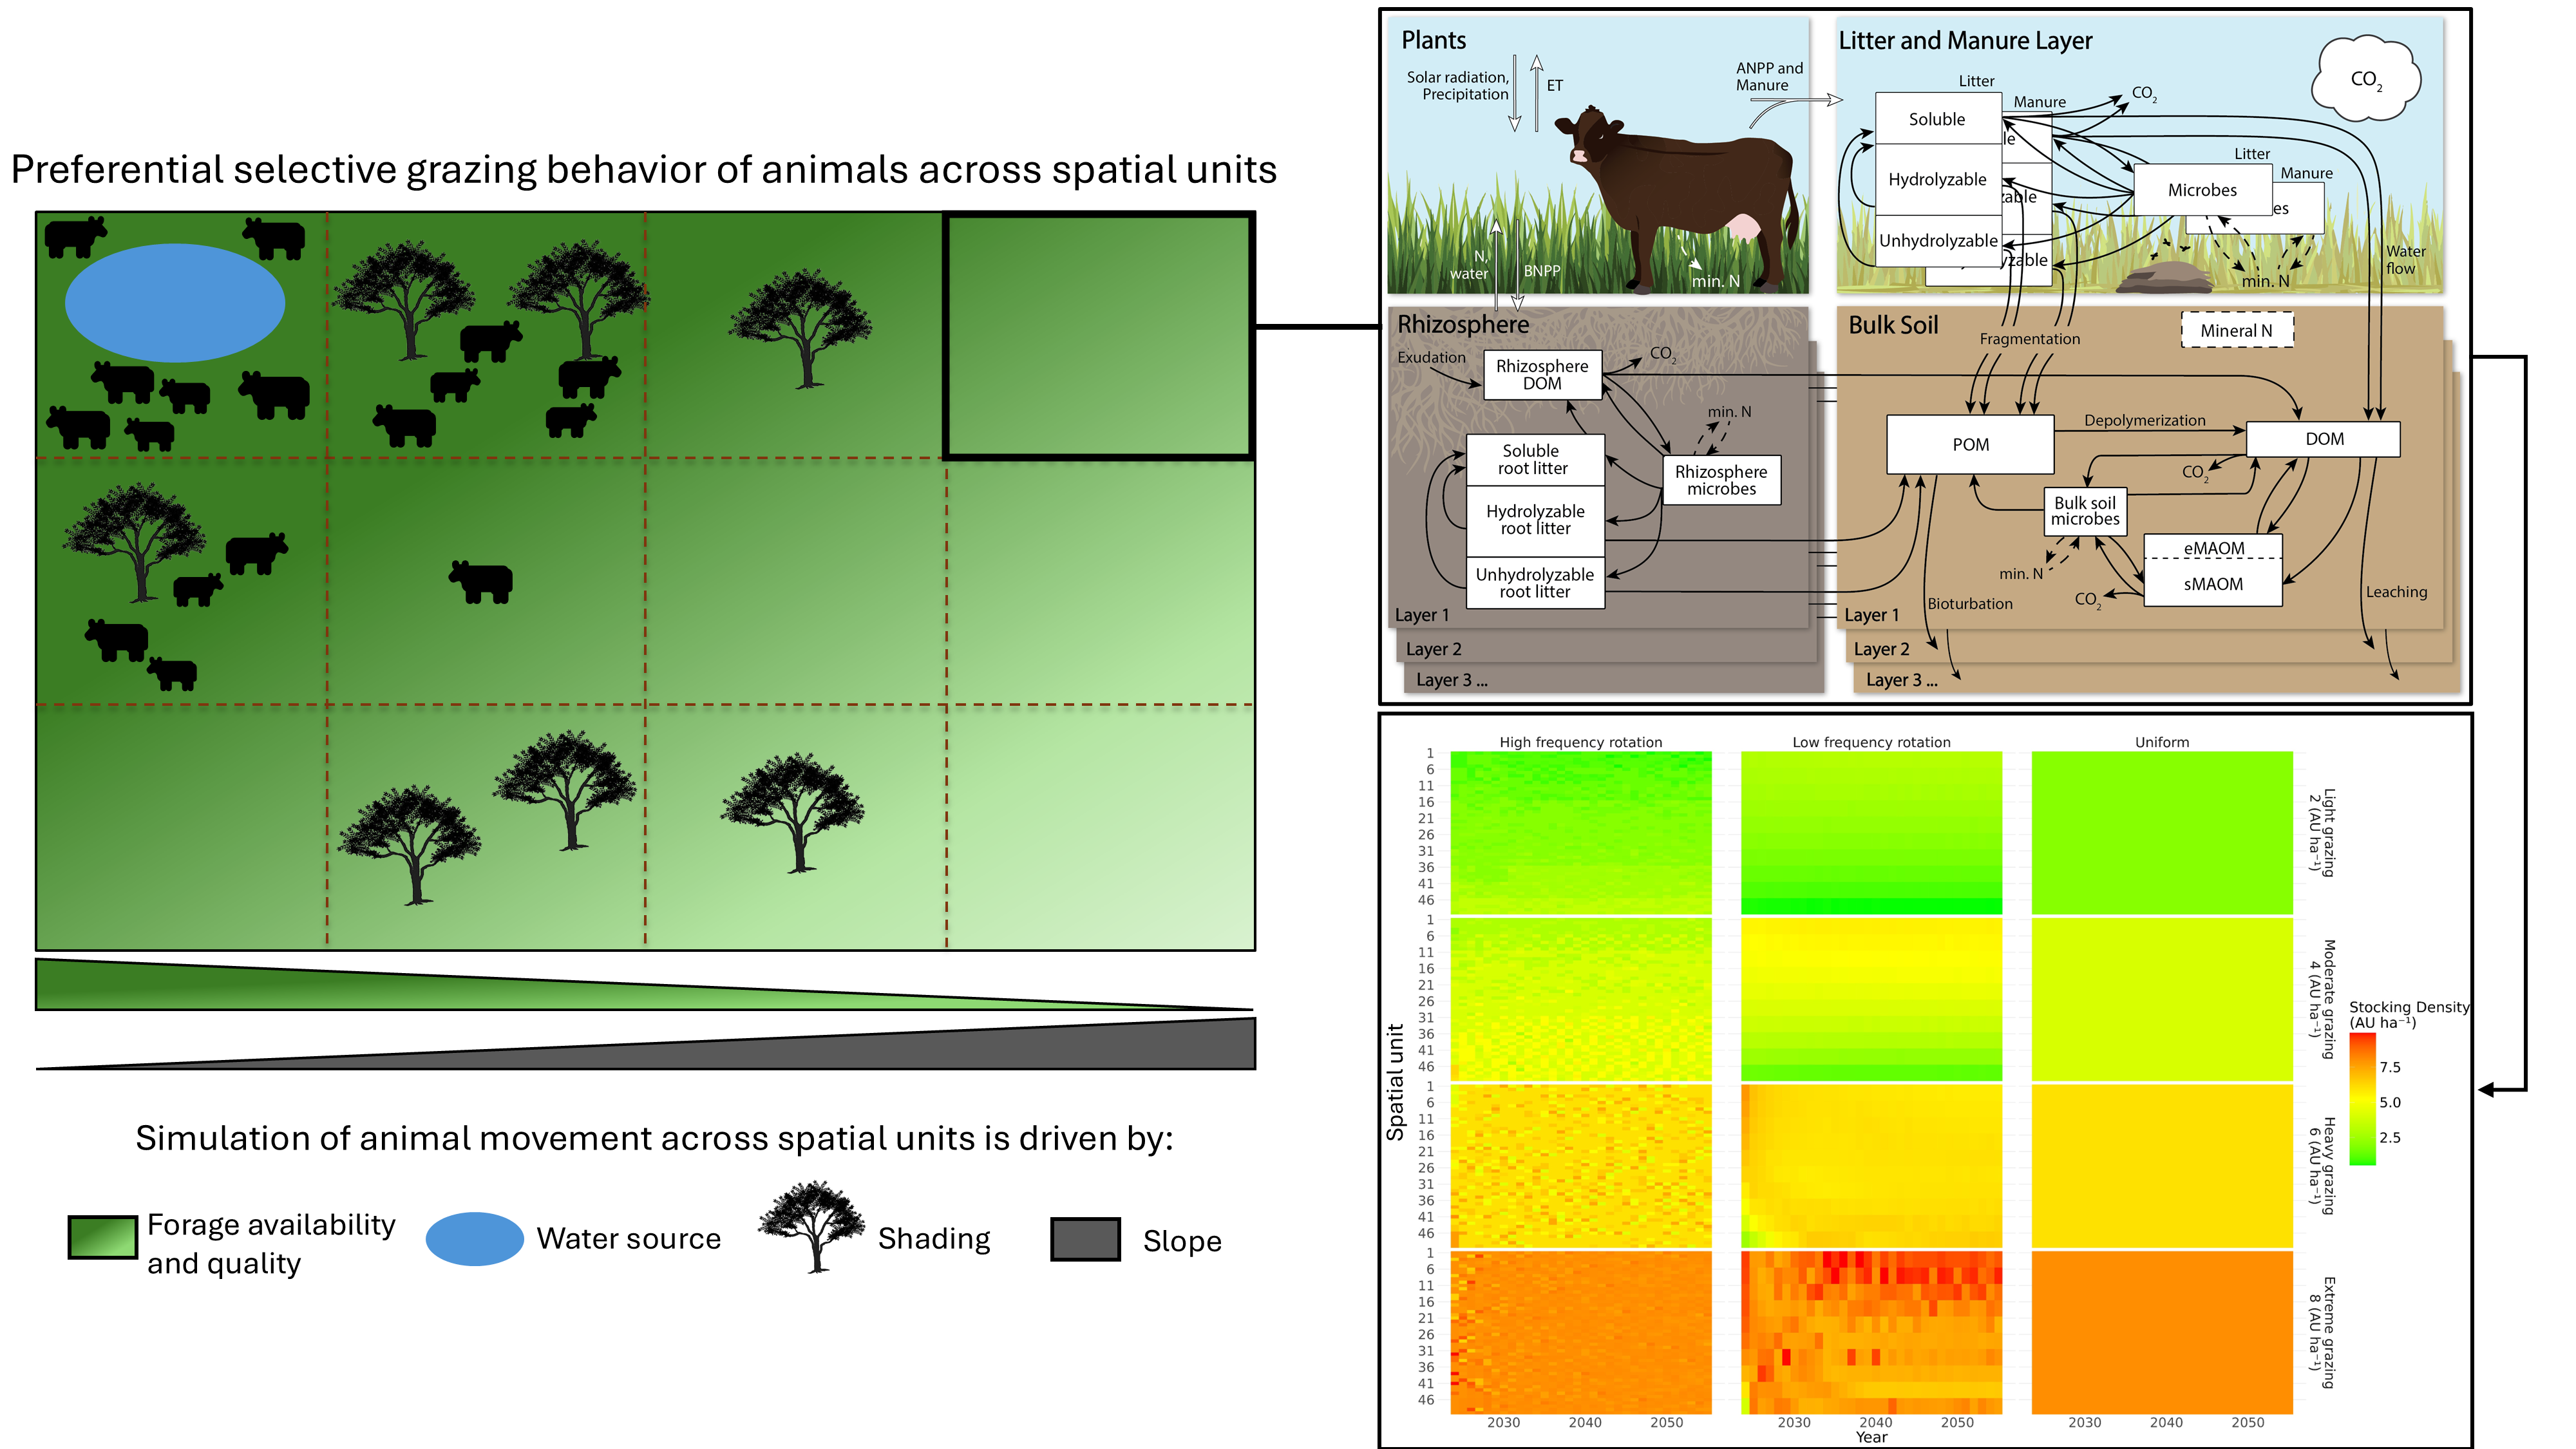
Figure 3. Schematic representation of the MEMS V3 ecosystem model representing the inclusion of livestock grazing contributing to manure and mineral N inputs to soils. A field is divided into spatial units in this version. For continuous or low frequency grazing management, animal distribution among these spatial units is calculated based on forage availability and quality, distance to drinking water source, shading and slope. The heat map shows the predicted animal distribution for low and high frequency rotation and uniform grazing management.
To the best of our knowledge, all existing process-based ecosystem models assume an even spatial distribution of animal activity regardless of pasture size or stocking density. However, in reality —particularly under continuous grazing and low frequency rotation grazing— animals often distribute themselves unevenly, leading to some areas being heavily grazed while others remain largely untouched or lightly grazed. The uneven distribution of animals can lead to uneven utilization of forage and subsequently affect plant growth and SOC storage.